Processing Math: Done
To print higher-resolution math symbols, click the
Hi-Res Fonts for Printing button on the jsMath control panel.

No jsMath TeX fonts found -- using image fonts instead.
These may be slow and might not print well.
Use the jsMath control panel to get additional information.
jsMath Control PanelHide this Message


jsMath

Solution 2.3:8a

From Förberedande kurs i matematik 1

(Difference between revisions)
Jump to: navigation, search
m
Current revision (12:30, 29 September 2008) (edit) (undo)
 
Line 6: Line 6:
|align="center"|[[Image:2_3_8_a-1.gif|center]]
|align="center"|[[Image:2_3_8_a-1.gif|center]]
| width="10px"| 
| width="10px"| 
-
|align="center"|[[Image:2_3_8_a-1.gif|center]]
+
|align="center"|[[Image:2_3_8_a-2.gif|center]]
|-
|-
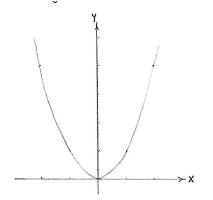
|align="center"|<small>The graph of ''f''(''x'')&nbsp;=&nbsp;''x''²</small>
|align="center"|<small>The graph of ''f''(''x'')&nbsp;=&nbsp;''x''²</small>

Current revision

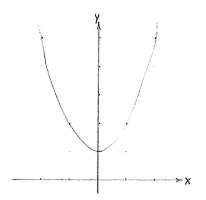
The curve y=x2 is a parabola with a minimum at the origin according to the figure below on the left and, compared with that curve, y=x2+1 is the same curve but with the number 1 added to the y-coordinate of each point, i.e. the parabola is shifted one unit up in the y-direction.


The graph of f(x) = x² The graph of f(x) = x² + 1