Solution 2.3:8b
From Förberedande kurs i matematik 1
(Difference between revisions)
m |
|||
| Line 1: | Line 1: | ||
| - | As a starting point, we can take the curve | + | As a starting point, we can take the curve <math>y=x^{2}+2</math> which is a parabola with a minimum at (0,2) and is sketched further down. Compared with that curve, |
| - | <math>y=x^{2}+2</math> | + | <math>y = (x-1)^{2}+2</math> is the same curve in which we must consistently choose ''x'' to be one unit greater in order to get the same ''y''-value. The curve <math>y = (x-1)^{2}+2</math> is thus shifted one unit to the right compared with <math>y=x^{2}+2</math>. |
| - | which is a parabola with a minimum at | + | |
| - | + | ||
| - | and is sketched further down. Compared with that curve, | + | |
| - | <math>y= | + | |
| - | is the same curve in which we must consistently choose | + | |
| - | + | ||
| - | to be one unit greater in order to get the same | + | |
| - | + | ||
| - | -value. The curve | + | |
| - | <math>y= | + | |
| - | is thus shifted one unit to the right compared with | + | |
| - | <math>y=x^{2}+2</math>. | + | |
| - | [[Image:2_3_8_b.gif|center]] | + | {| align="center" |
| + | ||[[Image:2_3_8_b-1.gif|center]] | ||
| + | |width="10px"| | ||
| + | ||[[Image:2_3_8_b-2.gif|center]] | ||
| + | |- | ||
| + | ||<small>The graph of ''f''(''x'') = ''x''² + 2</small> | ||
| + | || | ||
| + | ||<small>The graph of ''f''(''x'') = (''x'' - 1)² + 2</small> | ||
| + | |} | ||
Revision as of 12:56, 29 September 2008
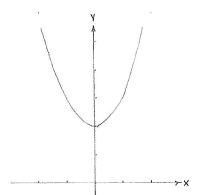
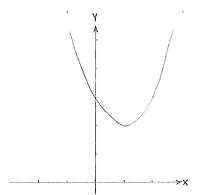
As a starting point, we can take the curve \displaystyle y=x^{2}+2 which is a parabola with a minimum at (0,2) and is sketched further down. Compared with that curve, \displaystyle y = (x-1)^{2}+2 is the same curve in which we must consistently choose x to be one unit greater in order to get the same y-value. The curve \displaystyle y = (x-1)^{2}+2 is thus shifted one unit to the right compared with \displaystyle y=x^{2}+2.
| The graph of f(x) = x² + 2 | The graph of f(x) = (x - 1)² + 2 |


