Solution 2.3:8a
From Förberedande kurs i matematik 1
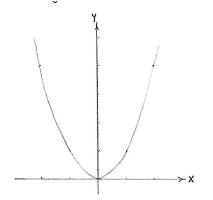
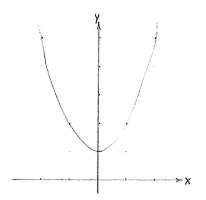
The curve \displaystyle y=x^{2} is a parabola with a minimum at the origin according to the figure below on the left and, compared with that curve, \displaystyle y=x^{2}+1 is the same curve but with the number 1 added to the y-coordinate of each point, i.e. the parabola is shifted one unit up in the y-direction.
| The graph of f(x) = x² | The graph of f(x) = x² + 1 |


