Lösung 1.3:2a
Aus Online Mathematik Brückenkurs 2
(Unterschied zwischen Versionen)
K |
K (Robot: Automated text replacement (-{{Displayed math +{{Abgesetzte Formel)) |
||
| Zeile 9: | Zeile 9: | ||
<ol> | <ol> | ||
<li>The derivative of <math>f(x)</math> is given by | <li>The derivative of <math>f(x)</math> is given by | ||
| - | {{ | + | {{Abgesetzte Formel||<math>f^{\,\prime}(x) = 2x-2</math>}} |
and becomes zero when <math>2x-2=0</math>, i.e <math>x=1\,</math>.</li> | and becomes zero when <math>2x-2=0</math>, i.e <math>x=1\,</math>.</li> | ||
Version vom 12:55, 10. Mär. 2009
A function has its local extreme points at the following types of points:
- critical points, i.e. where \displaystyle f^{\,\prime}(x)=0,
- points where the function is not differentiable, and
- endpoints of the interval of definition.
We investigate these cases for our function:
- The derivative of \displaystyle f(x) is given by
and becomes zero when \displaystyle 2x-2=0, i.e \displaystyle x=1\,.\displaystyle f^{\,\prime}(x) = 2x-2 - Because the function is a polynomial, it is differentiable everywhere.
- The function is defined regardless of the value of x, which means that the interval of definition is the whole real axis, and there are therefore no endpoints.
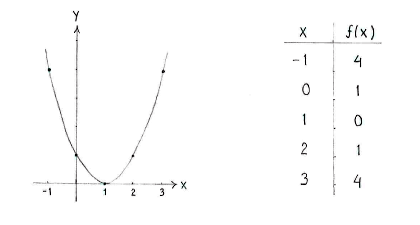
The only point where the function could possibly have a local extreme point is thus \displaystyle x=1\,. In order to determine whether the point is a local extreme point, we investigate the derivative using a sign table.
| \displaystyle x | \displaystyle 1 | ||
| \displaystyle f^{\,\prime}(x) | \displaystyle - | \displaystyle 0 | \displaystyle + |
| \displaystyle f(x) | \displaystyle \searrow | \displaystyle 0 | \displaystyle \nearrow |
Because the derivative is negative to the left of \displaystyle x=1 and positive to the right of \displaystyle x=1, then \displaystyle x=1 is a local minimum.
The sign table also gives information about the graph's approximate appearance and by calculating the value of the function at a couple of points, we can make a sketch of the graph.

